Tag Archives: Analysis

Lighting Calculations Using Relux

The following task uses the free lighting software, Relux, to perform a simple lighting calculation for a small office.

A CAD layout of the office is first uploaded into Relux. The CAD plan is a DWG file.

screen1

CAD plan imported into Relux

The room is then drawn by plotting the corners of the inside office walls. Once the room is drawn we can edit the height of the room. In this case, we are using a false ceiling height of 3 metres. We can then add room details, such as windows, doors and in this office, several structural pillars. If necessary, room furniture e.g. desks, computers, chairs etc. can be added. This will be detailed in a later exercise.

Once the room structure and furniture have finalised, luminaires can be added to the room. In Relux, this can be done in several ways: loading a new luminaire from a file stored on your computer or the built-in data base ReluxNet.

The luminaire chosen for this project is a square modular, recessed luminaire by Thorn Lighting (Chosen Luminaire), as there is an existing 600 x 600 mm ceiling grid already installed in the office, on which the new luminaires will be fixed. The Relux files are simply downloaded from the Thorn website and imported into Relux.

For an office of this type i.e. filling, copying etc. EN 12464-1 “Lighting of Indoor Workplaces” tells us that the minimum lux levels required is 300 lux (Zumtobel Lighting Handbook). If needed, we can edit the type of room within Relux, so that when the lighting calculations are performed, Relux will automatically compare the results to the standard required levels.

Luminaires are added to the room either manually, or by using the EasyLux procedure. The EasyLux procedure will automatically place luminaires within the room depending on your required lux level and luminaire suspension height. However, this function does not consider room objects, and will place luminaires that will clash with our structural pillars.

screen2

The finial layout, including doors, windows, pillars and luminaires.

Once our luminaires are placed and we are happy with our layout, we can run the lighting calculation to see whether the room is lit sufficiently. Relux is able to display calculation results in numerous formats, including 3D views simulating the lighting within the room. A false colour view enables us to see what parts of the room are well lit (coloured green) and what parts of the room are dark (red areas).

screen3

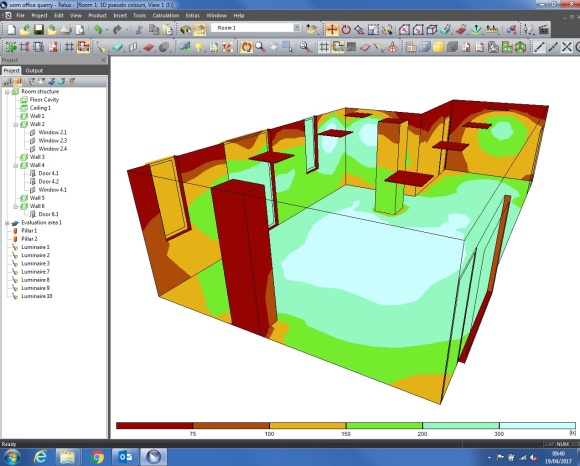
False colour plot of the lighting levels. The floor of the room is well lit, whilst the corners are dimmer.
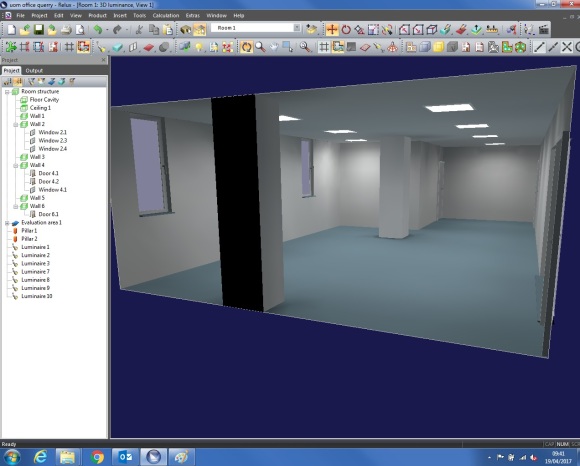
screen4

3D room simulation.

We can see that our layout lights the room to a sufficient level, well above the 300 lux required. If this wasn’t the case, we can simply return to our layout view and either reposition the luminaires or add more, and re-run the calculation.

Tagged , ,

Contact Analysis

So far I have performed static analysis on several parts, but what if we want to test multiple parts that are connected or linked?

Contact analysis allows us to do this. In this test several rings form a link, to form an assembly that could possibly be a towel holder.

ring

Drawings provided by Karl Gregory, 2016, University of Bolton.

The set up is similar to previous static analysis, creating a fixed geometry behind the little link to simulate fixing to a wall. We must create, however, no penetration contact sets between the links in order to stop Solidworks from simply pulling one link through the other. An advanced geometry is also created on the bigger ring, telling Solidworks the bigger ring may only move downwards and not side to side.

We perform contact analysis to determine how the links interact. To achieve the best possible analysis we need to use a fine mesh, however, a fine mesh applied to all of the assembly is unnecessary, and would slow the simulation. A control mesh is created around the area of contact, a fine mesh is applied in the region of contact and a course mesh to the rest of the assembly. This finer mesh provides greater detail of stress around the area of contact.

In this case a simulated load was added to the bottom of the larger ring to determine whether the contact would cause the ring to yield.

Tagged , , , , ,

Frequency Analysis

Ever seen the Chladni Plates experiment?

Using SolidWorks, we can analyse a square or circular plate to find the frequencies these patterns will occur.

plate freq analysis

The areas in blue in the above picture are those in which the salt or sand in the video would gather, they are areas of least movement. Here the sound waves are cancelling each other creating a node. The areas in red are the opposite, here the sound waves are interfering and combining to give a larger amplitude, forcing the sand to vibrate and settle in the blue areas.

If we change the material of the plate, say from plastic to metal, the frequencies of these modes will change.

Frequency ∝ √(Elastic modulus/density)

This relationship is 3.5 times larger in the metal, meaning the modal frequencies should be 3.5 times larger.

The results aren’t exact, but near to the expected results. This discrepancy could come from the applying of a new mesh, when changing the material study.

Tagged , , , ,

Bracket Design and Analysis

Brief

Company has provided a rough sketch of their flower basket bracket and would like some analysis performed to test whether the design is feasible.

clients design

Rough sketch

The distance to the hanging load, A, was determined to be around 300 mm, allowing for the radius of the basket and clearance from the wall.

The chosen bracket material: mild steel

Testing

The weight of the basket tested was 12 Kg. The bracket’s performance was poor.

To improve upon the client’s design, without altering the original significantly, a support was added. The mild steel still yields under load, however.

Conclusion

The design supplied by the client is not suitable for the hanging of a flower basket. A completely new design is needed.

Tagged , ,